User Manual for Report Designer
Requirements
- Microsoft Dynamics NAV 2015 (first release) or later versions;
- a working internet connection is necessary to design the reports;
- a working development license is required cince the tool runs as a set of NAV objects;
- .NET framework 4.0 or later should be installed on server system.
Quick Start
Get familiar with the designer. It consists of
- Object properties
- Dataset designer
- Layout designer
Use the dataset designer to build your dataitem tree.
Use the Layout designer to build Header, Body and Footer sections and place textboxes and other elements inside them. You can do it manually or you can select tables and fields in the dataset and click Add to Layout.
Note that sections are equivalent to Classic NAV report sections.
Elements are placed in sections using a grid layout. Elements can be placed vertically (layout Rows) and horizontally (layout Columns’).
You can check what your layout looks like in the Preview page (Preview action) or you can even work with it open alongside SRD.
If you want to write C/AL code - go to Globals.
To build a NAV report - use action Build (F11) and Run (Ctrl+R) to test it. For more details, read this manual or our blog at www.simplanova.com/blog
Simplanova Report Designer features
- Simple NAV report development.
- Compatible with NAV 2013 and later versions
- Works in the Role-Tailored Client.
- Portable (you can use it on any database, transfer both SRD reports and produced reports to other databases).
- Produces native NAV reports with RDLC layout.
- Multilingual (constants, captions and labels).
- Dataset designer (for data model design).
- Automatically naming dataset elements.
- Data compression (better performance, not to overflowing users' memory, fully customizable).
- Automatic conversion of labels to captions and vice-versa (for dynamically changed language).
- Layout designer.
- Preview add-in (visual representation of a report).
- NAV classic report concepts - header, footer, body sections.
- Page designer concepts - grid layout (columns or rows), tree-like design.
- Simple section building (converting dataset items to sections and textboxes).
- Straightforward Report Header and Report Footer building (no VB workarounds).
- Section, textbox, picture, line and rectangle element types.
- Simple definition of group headers and footers.
- Transport headers and transport footers.
- Aggregate functions (sum, count, average, running value).
- Customizable elements (fonts, sizes, colors, padding, borders).
- Dynamic visibility expressions (for hiding sections and textboxes).
- Simple element placement using group elements.
- Element floating (to left, right or center of parent element).
- Request page designer.
- C/AL code designer (compatible with all triggers, variable types and custom functions).
- Unit of Measure of your choice (centimeters and inches).
- NAV report conversion to SRD format.
- Advanced features:
- VB expressions (for source, visibility, styling).
- Top/Left coordinates.
- Report Header, Report Footer and Report Body section properties.
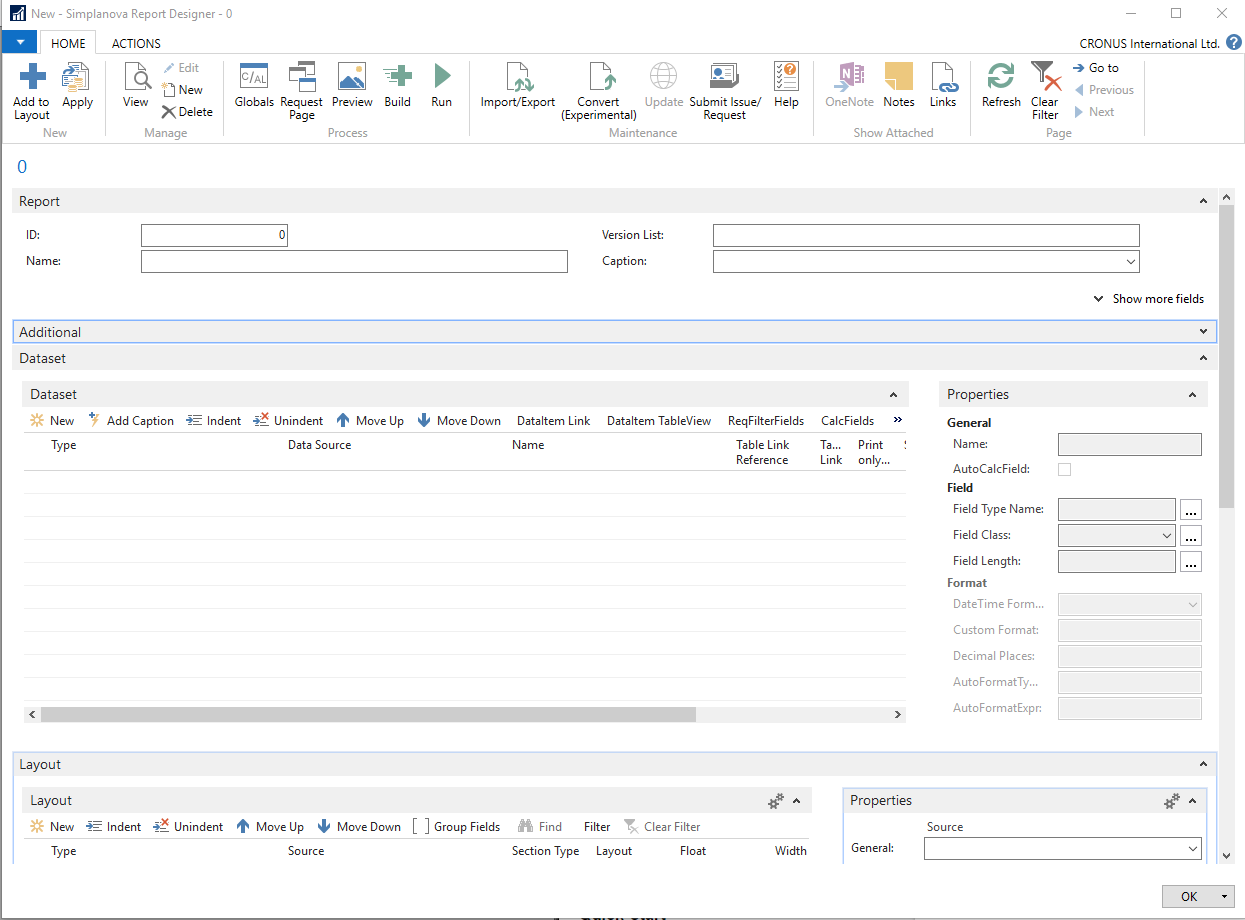
Using Simplanova Report Designer
To quickly guide you through the main features. The Report Designer card is divided into three sections:
- Report properties (object, page sizes and global properties)
- Dataset (table structure, fields, labels)
- Layout (sections and elements)
Process actions:
- Globals (variables, textconsts, methods, triggers)
- Build (generates NAV report object, imports it into NAV and compiles it)
- Preview (demonstrates what the report will look like, updates when refreshed)
- Run (runs the report object)
New actions:
- Add to Layout (select a table and a set of fields from the dataset and mark the last layout element, then click on this action to generate a section with a set of fields).
- Apply (select multiple layout elements, change a single property in the Layout Properties subpage and click Apply to apply the change on all layout items).
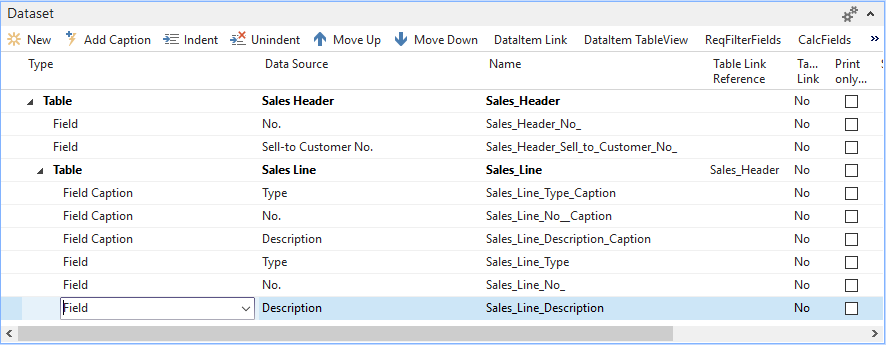
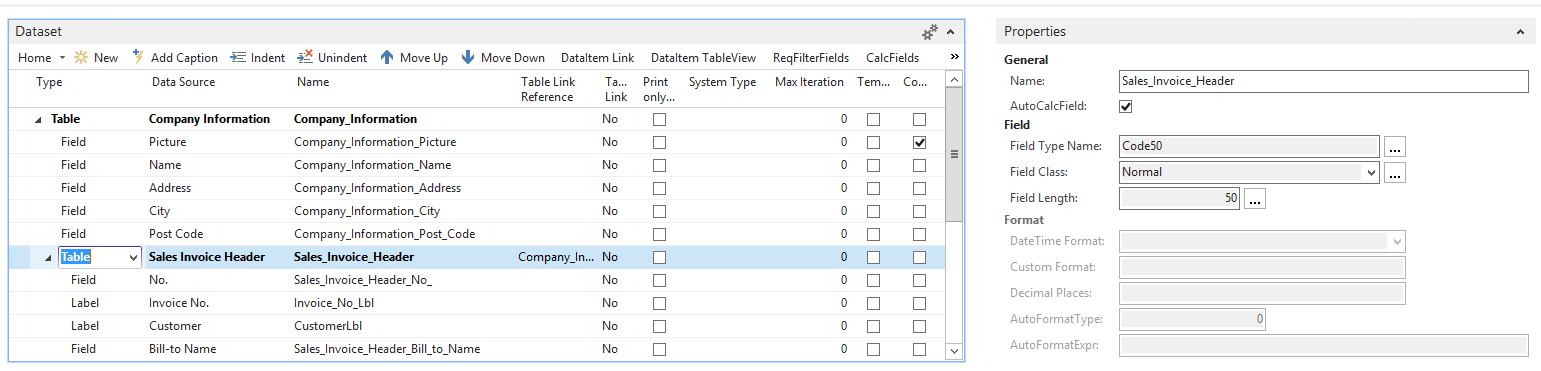
Dataset:
- The dataset is structured the same way as in standard NAV designer, except you've additionally got Labels and System items, which represent things like Page Number.
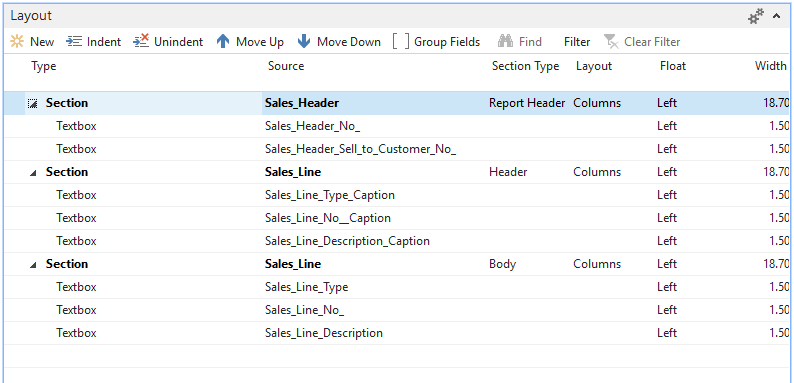
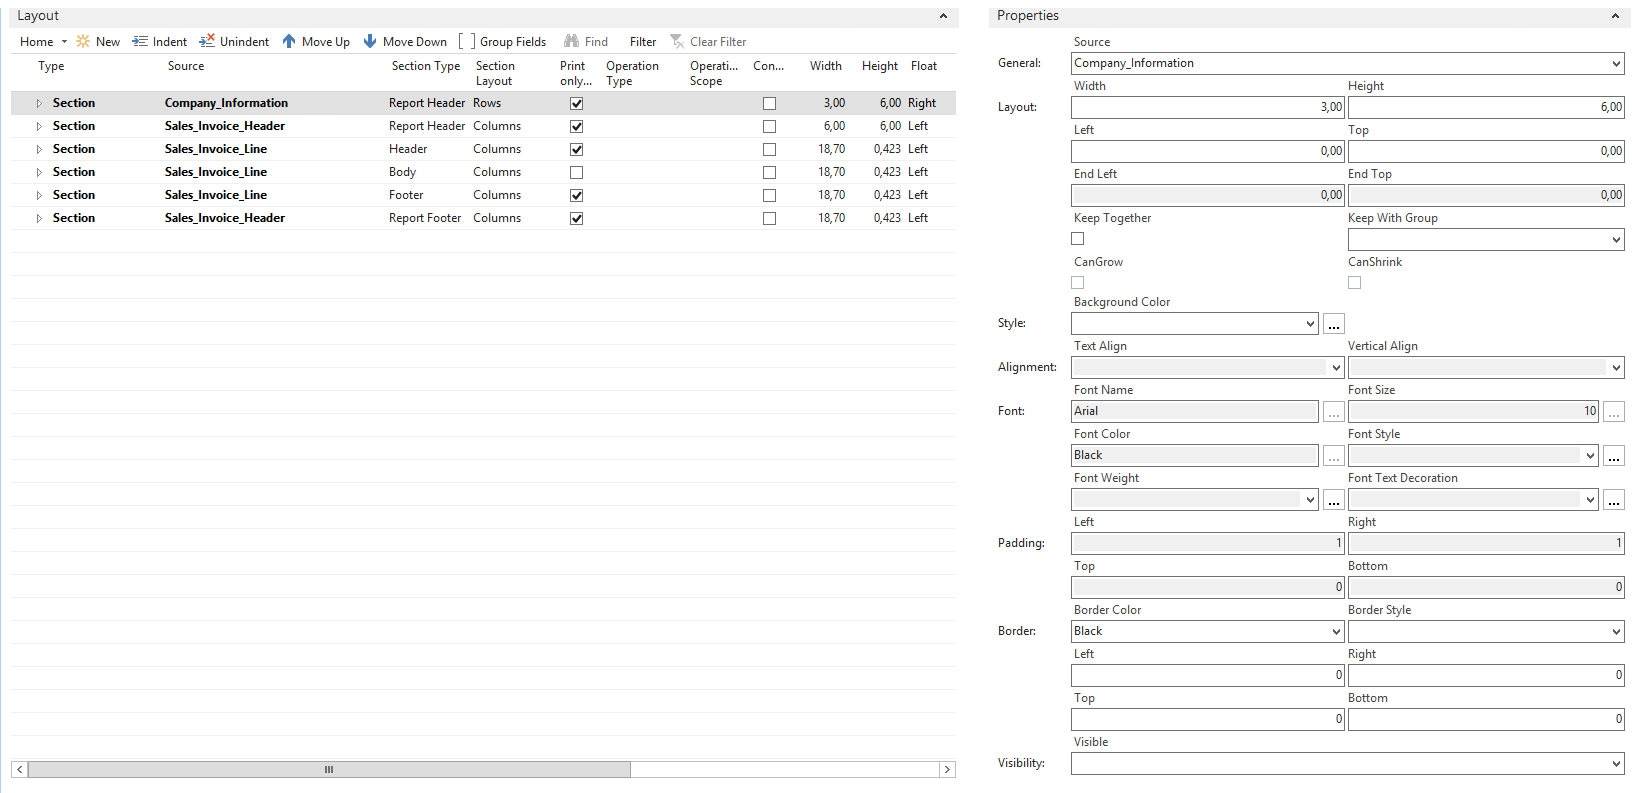
Layout:
- Layout is structured similarly to Classic NAV reporting - you have sections at the bottom level and all the elements inside of them.
- It is also similar to the page designer grid layout - you can use groups to join several elements and use layout of columns or rows (horizontal or vertical layering of elements).
- The default flow is Columns, meaning every consecutive element is added from left to right of each other.
- When you use Rows, every element is added below each other from top to bottom.
- Float option allows you to stick the elements either on the Left, Center or Right of the parent element. This is especially helpful, when working with Report Header or Report Footer.
- Coordinates can be overridden manually (left and top columns), but in that case the element will not follow the layout and float properties anymore. Coordinates are relative to the parent control.
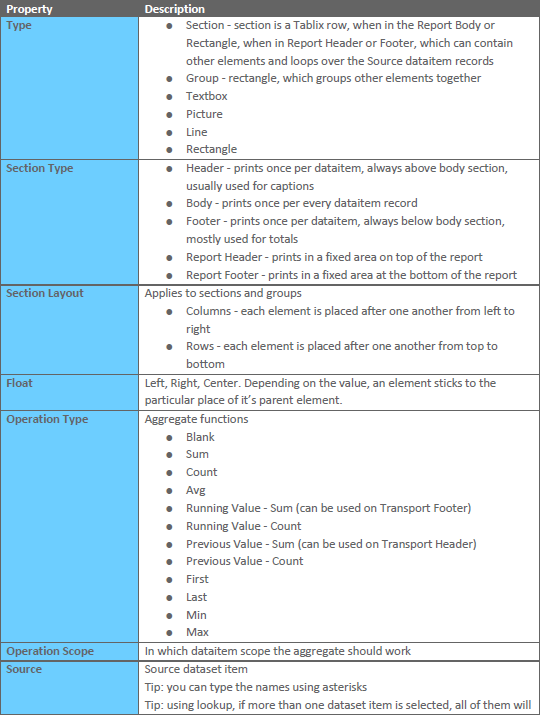
- Sections can be of 5 types: report header, report footer, header, body, footer.
- And you can have group headers and footers, if you fill out Group Fields on a section.
- Use Operation Type column for aggregate functions like sums and also to simulate the transheader and transfooter behaviour.
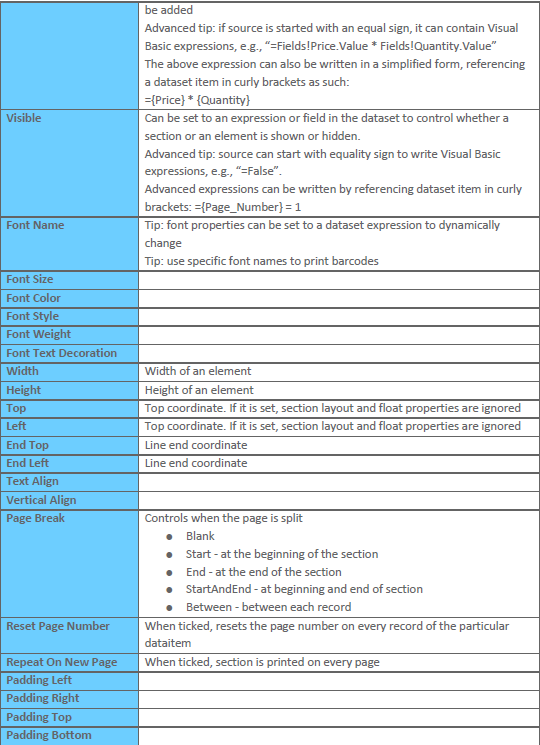
- Expressions are for advanced users, because it allows writing VB.NET code into the Source column. In order to do it, start your Source with = sign. E.g., =Fields!Quantity.Value * Fields!Unit_Price.Value
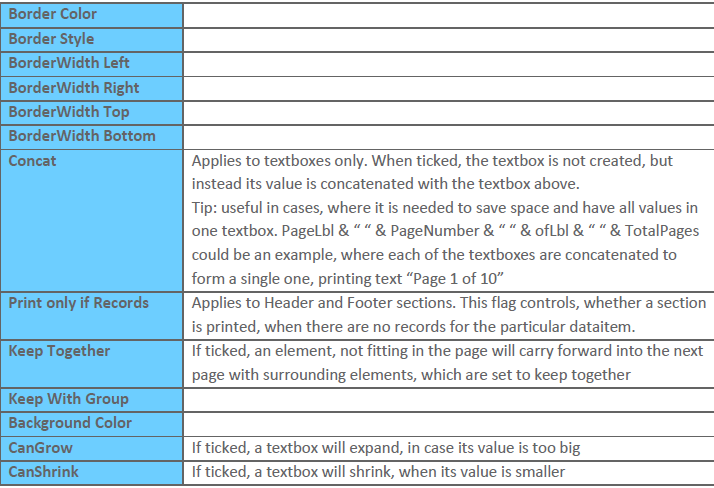
- Concat checkbox joins a textbox with the one above it and can be used to concatenate several dataset fields into a single one (best used with „Page X of Y“ label).
- Visible property allows you to set a boolean field, which would control the visibility of any report element.
Menu
Report Designer menu can be navigated via Simplanova Tools \ Report Designer department.
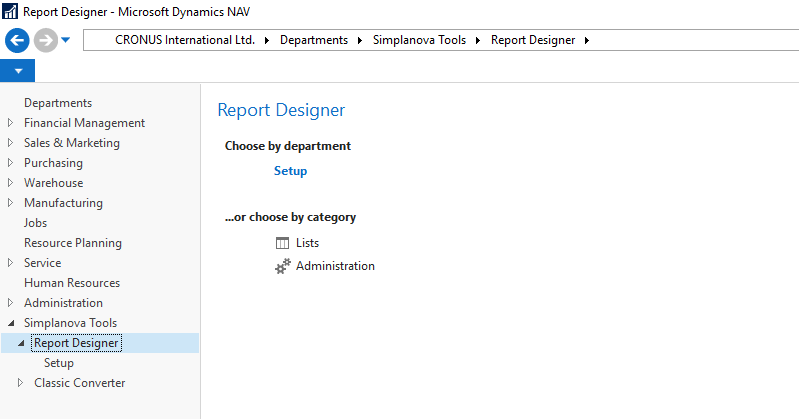
Report Designer
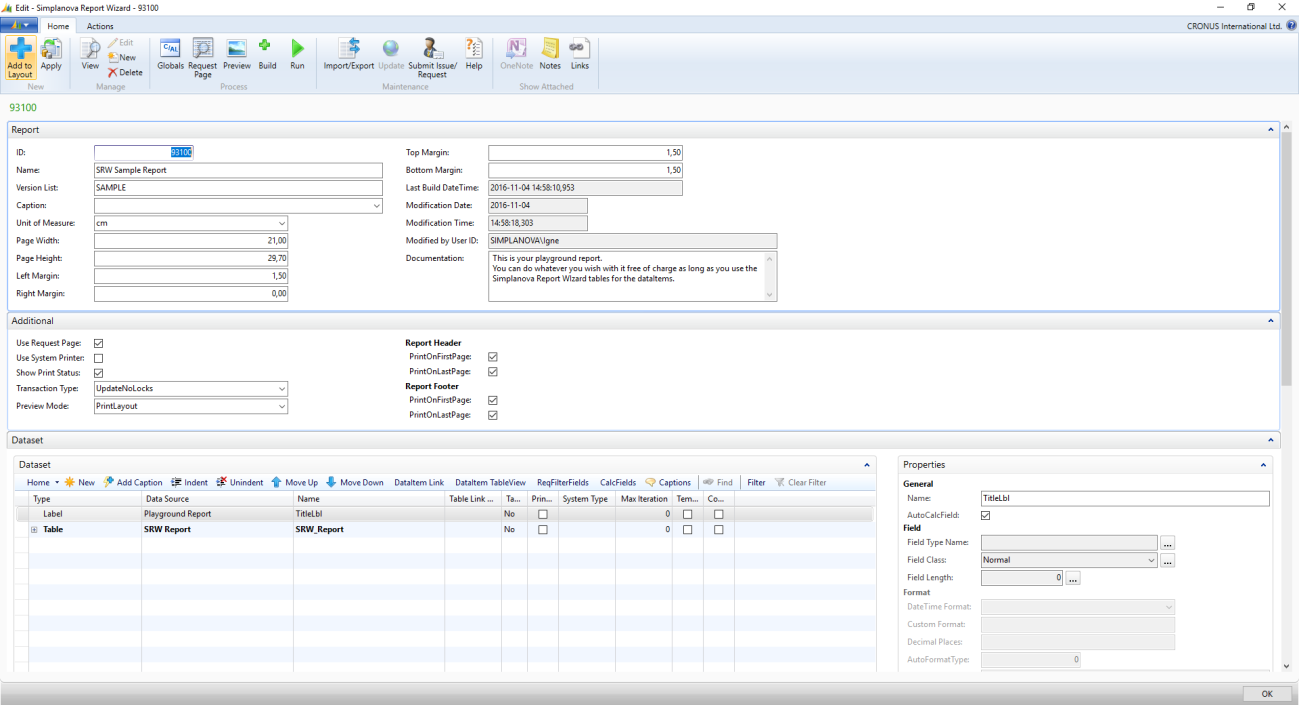
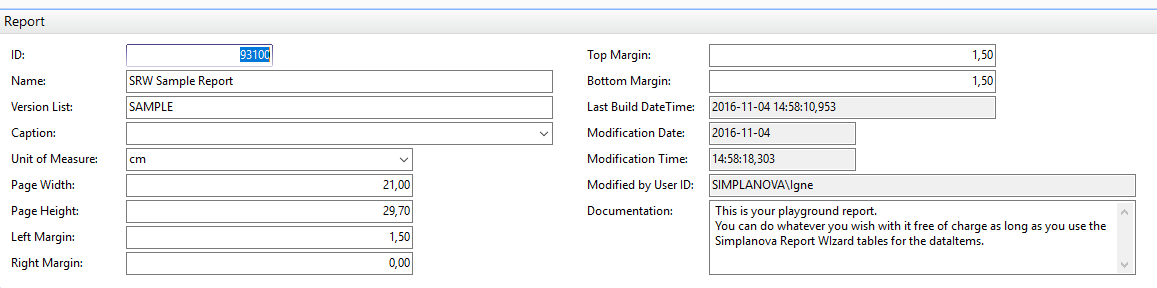
The Report Designer main page consists of three main parts: header, dataset and layout. Header contains all the object and page information, dataset is the data model of the report and the layout contains the visual description of the report.
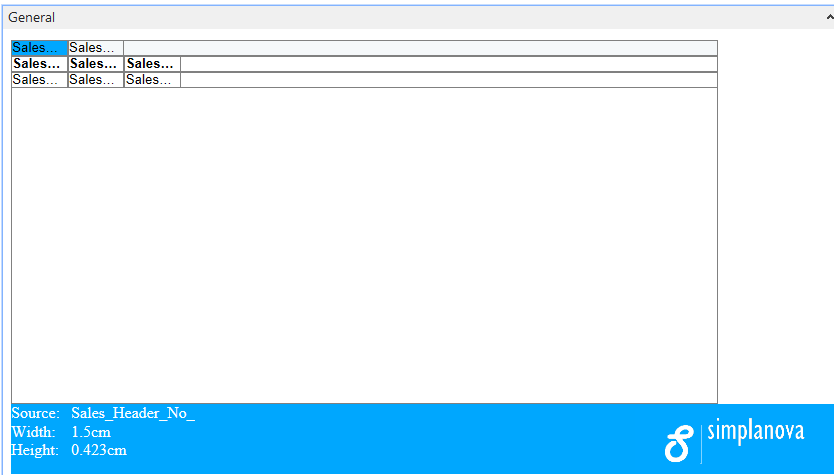
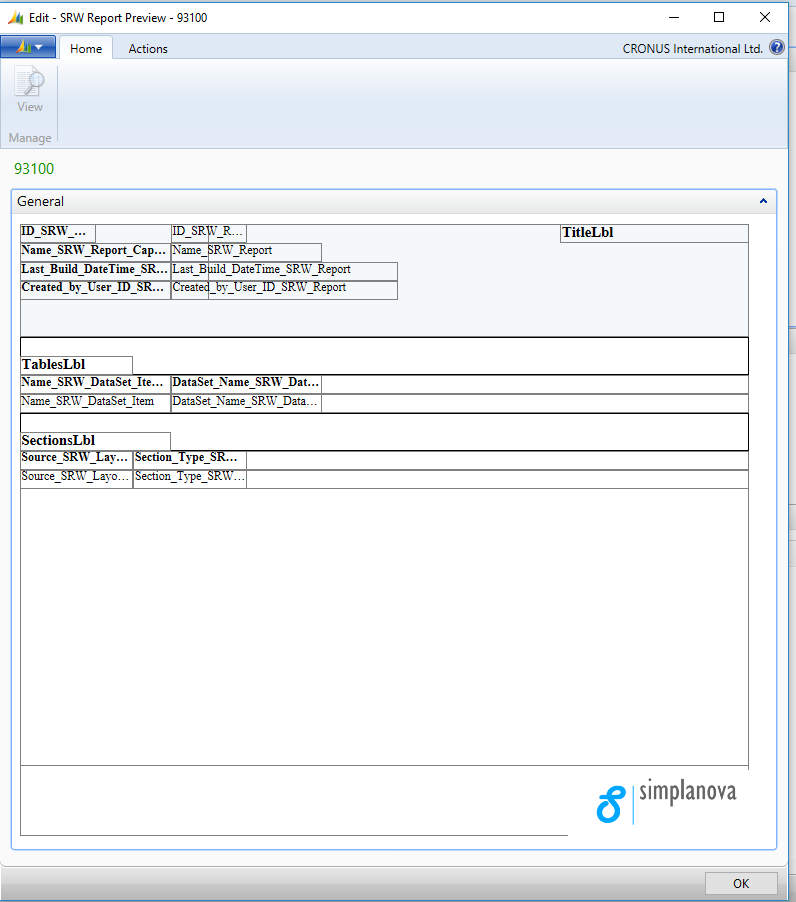
Preview
Shortcut: Ctrl + E
Shows the Preview add-in, where you can view what the report layout will look like. Can be used alongside Report Designer to see what changes are made. Additional information is shown when you point at an element on the preview.
Build
Shortcut: F11
Builds the NAV report object, imports it and compiles it automatically. Can be used while developing the report to test, to verify the layout or to validate C/AL code.
Run
Shortcut: Ctrl + R
Runs the generated NAV report.
Import/Export
Imports or exports the report object to an Xml file. Can be used for transferring a report to another client’s database.
Submit Issue/Request
Triggers a hyperlink to www.simplanova.com/support. You can login (or register if you haven’t previously) and submit a feature request or an issue you found.
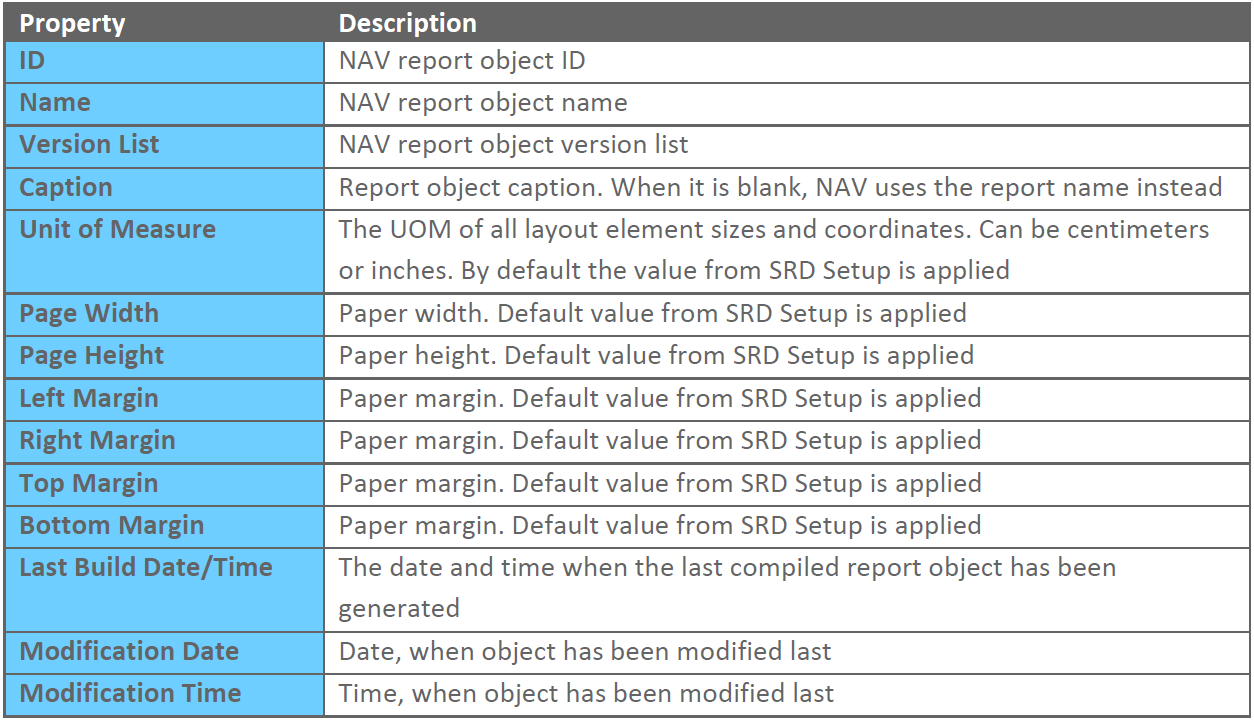
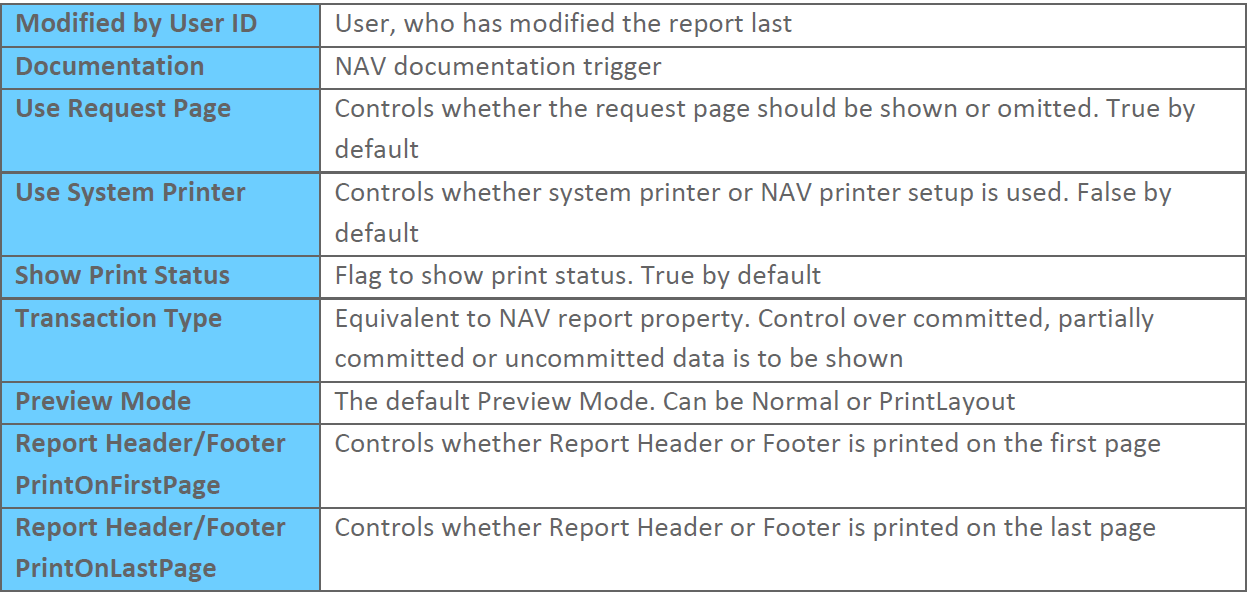
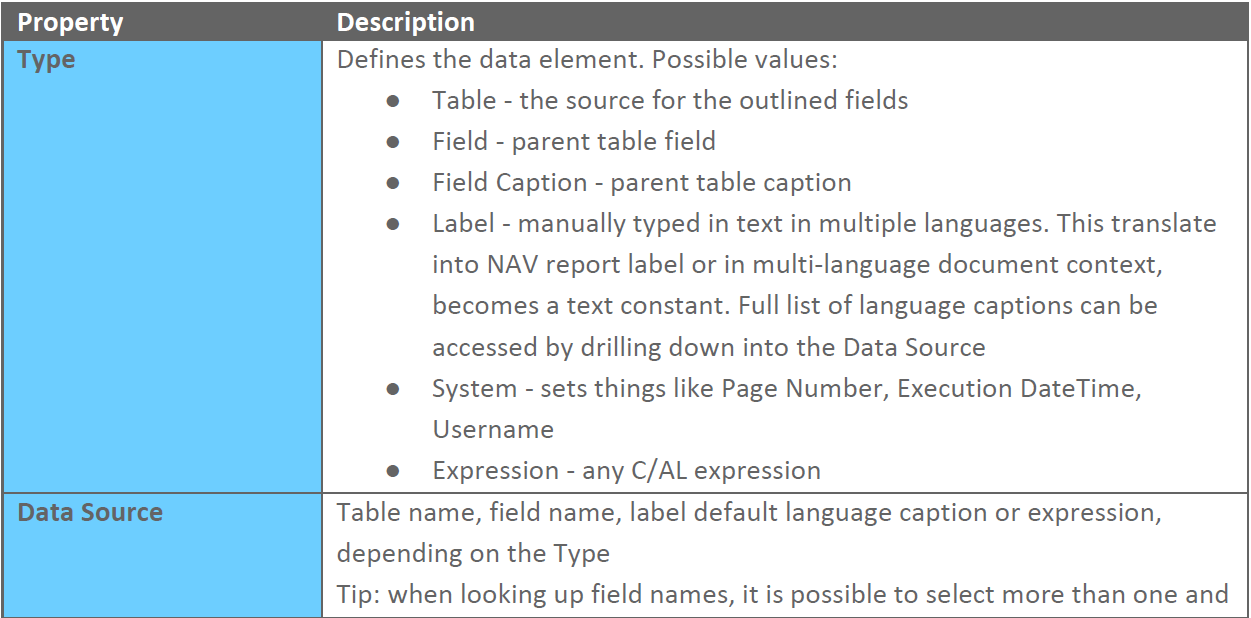
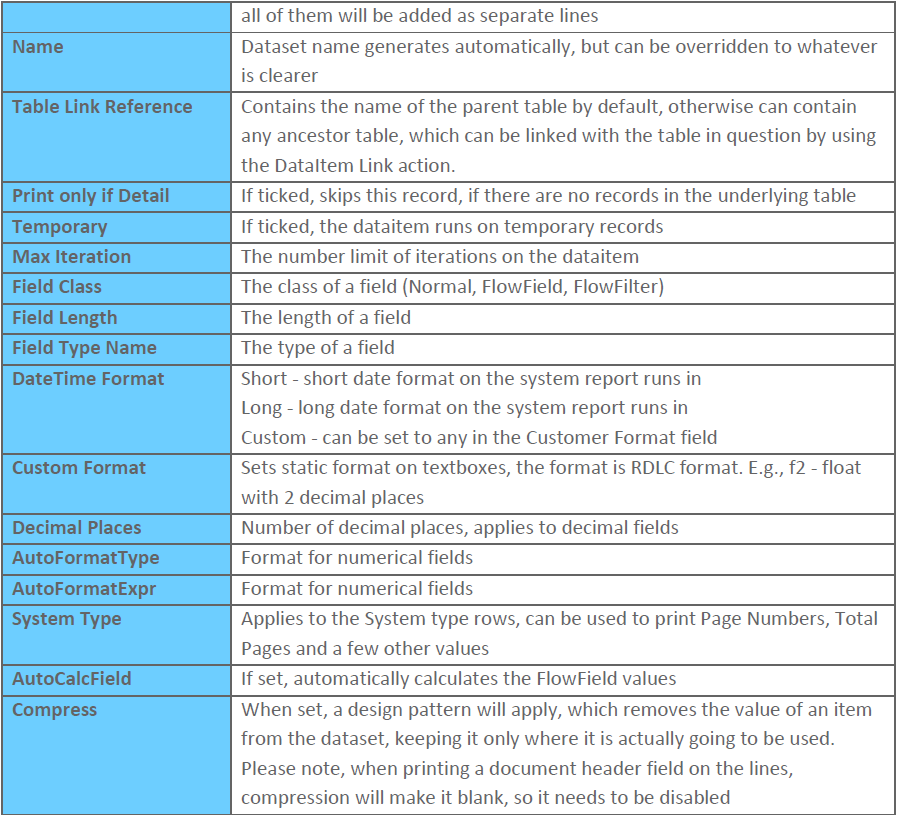
Report Properties

Dataset
Dataset controls the data structure of the report.
New
Shortcut: Ctrl + Insert.
Creates a new row below the selected one.
Add Caption
When one or more fields is selected, this function adds their corresponding captions in the dataset.
Indent
Shortcut: Alt+Shift+Right.
Indents selected rows.
Unindent
Shortcut: Alt+Shift+Left.
Unindents selected rows.
Move Up
Shortcut: Alt+Shift+Up.
Moves selected rows up.
Move Down
Shortcut: Alt+Shift+Down.
Moves selected rows down.
DataItem Link
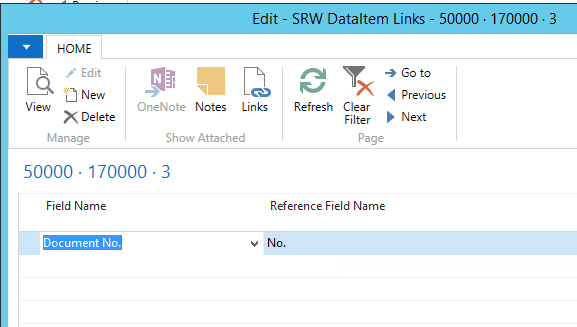
Shows a list of links between the current dataitem (table) and the one it is linking to.
DataItem TableView
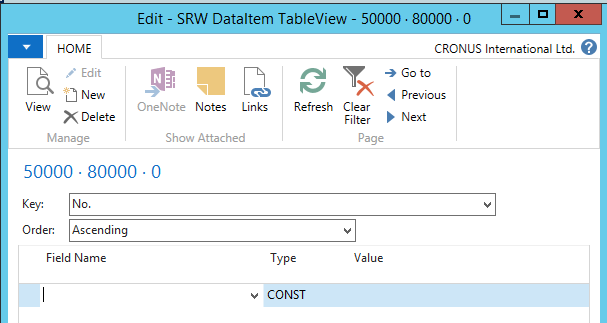
TableView allows to add static filters on certain columns and set the sorting order of a dataitem.
ReqFilterFields
Request filter fields allow setting a list of fields to filter by.
CalcFields
A list of flowfields to be calculated, when reading records from the database.
Captions
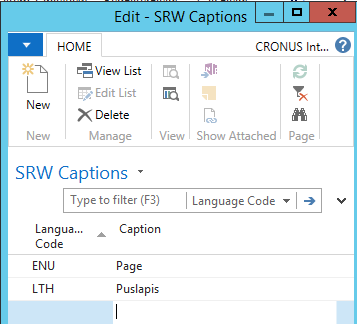
Applies to labels only, shows a list of captions in different languages.
Layout
Report layout is built in an intuitive way, which is different from the usual drag and drop type of workflow. Instead it works like NAV page designer, where elements are grouped together and placed partially automatically.
The placement of elements works in two modes: absolute (when Left and Top properties are set to a particular coordinate) or grid (when element placement is controlled using Group element, Section Layout and Float properties).
tip
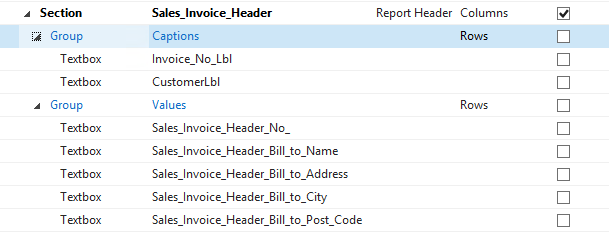
Use Group element to group report header elements together. For example, to group captions and values.

Add to Layout
Shortcut: Ctrl + D
This function can be called from the header and it adds all the selected Dataset items into selected place in the layout.
tip
Selected tables become sections and all other items become textboxes (BLOBs are set to Pictures). If you select a table with the fields you want in the section, you can add all of them in a click of a button. E.g., select table Sales Header and all Field Captions in it to create the Header section for this dataitem.
Apply
Shortcut: Ctrl + Q
Apply action sets the last changed property on all selected layout items. E.g., to quickly change the width of multiple textboxes, just change the first one, mark the rest and click Apply.
New
Shortcut: Ctrl + Insert.
Creates a new row below the selected one.
Indent
Shortcut: Alt+Shift+Right.
Indents selected rows.
Unindent
Shortcut: Alt+Shift+Left.
Unindents selected rows.
Move Up
Shortcut: Alt+Shift+Up.
Moves selected rows up.
Move Down
Shortcut: Alt+Shift+Down.
Moves selected rows down.
Group Fields
Applies to sections only. This option allows setting the group key for Header or Footer section. This way it is possible to build GroupHeaders and GroupFooters from any fields in the dataset.
caution
In order for group fields to work properly, they need to exist in the Sorting Key (or Primary Key, if sorting key is blank) of the containing DataItem.
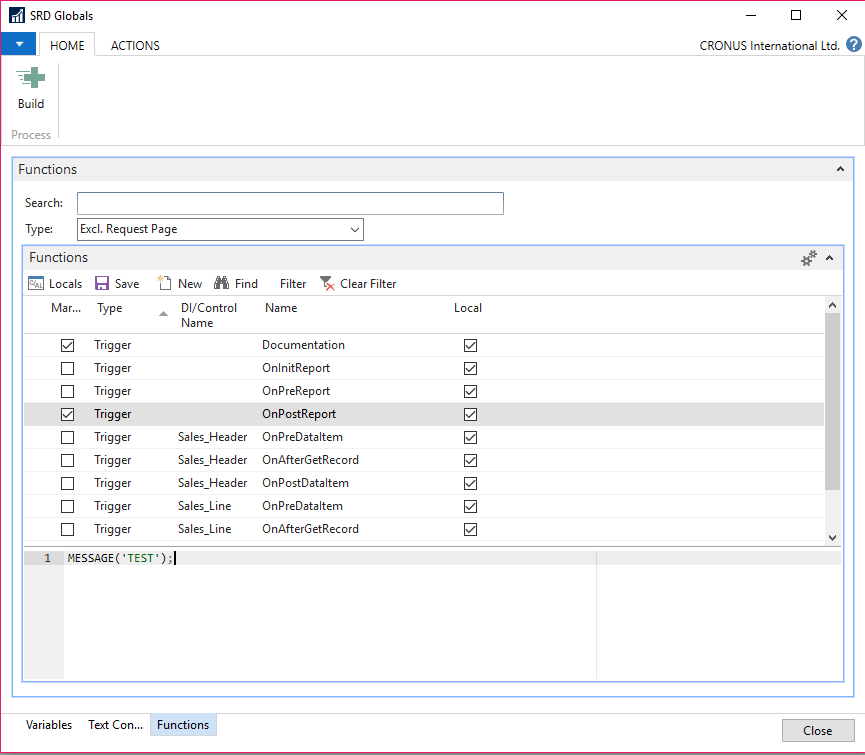
Globals
Shortcut: F9.
Action Globals contains functions, triggers and variables.
tip
custom functions can be simply inserted at the end of the list.
tip
to enter option variable option strings, use subtype column.

Search
Search bar marks all triggers and functions, which contain the text in it.
Locals
Gives access to local variables.
Save
Shortcut: Ctrl+S.
Saves the function or trigger changes. It is required to use the Save button in order to store the changes to the trigger or function code.
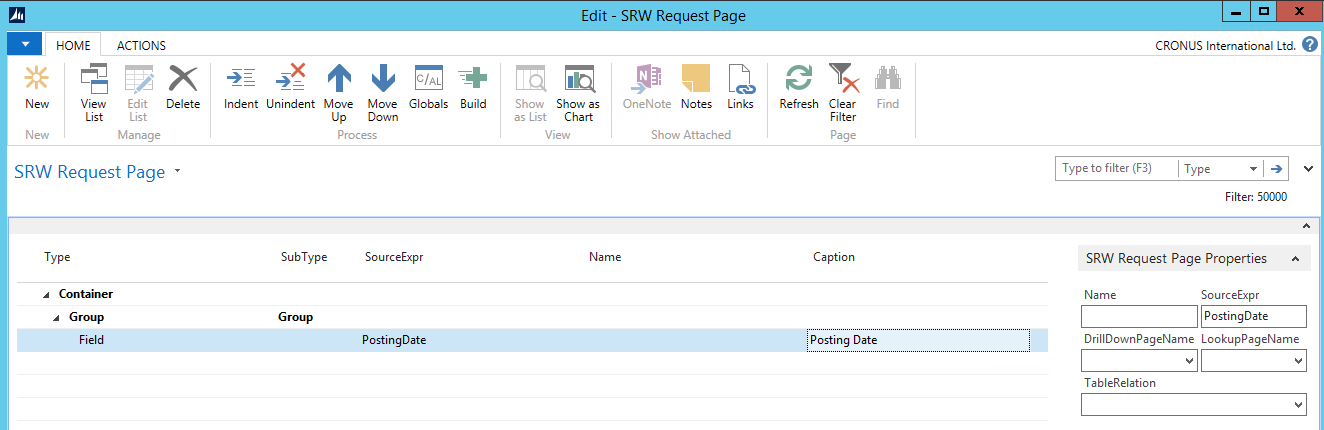
Request Page
Shortcut: F10.